Interfaces with data vizualization
2020—2023
International Media Group Rossiya Segodnya
Position: Deputy Department Head/Lead Designer
Team: 8 people
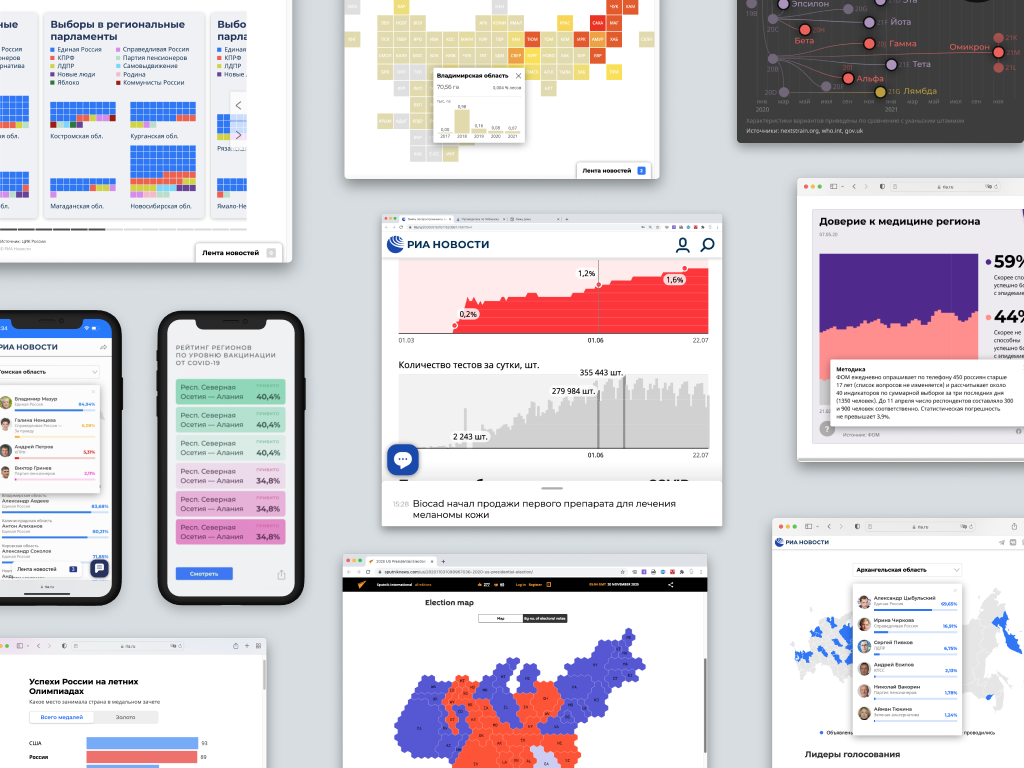
I have designed various interactive visualizations for several media platform: widgets, tools, charts, quiz, special projects.
Result
✦ Collected the main components of UI;
✦ Made several projects using dynamic data;
✦ Developed templates for designers;
✦ Developed tools for clients.
✦ Made several projects using dynamic data;
✦ Developed templates for designers;
✦ Developed tools for clients.
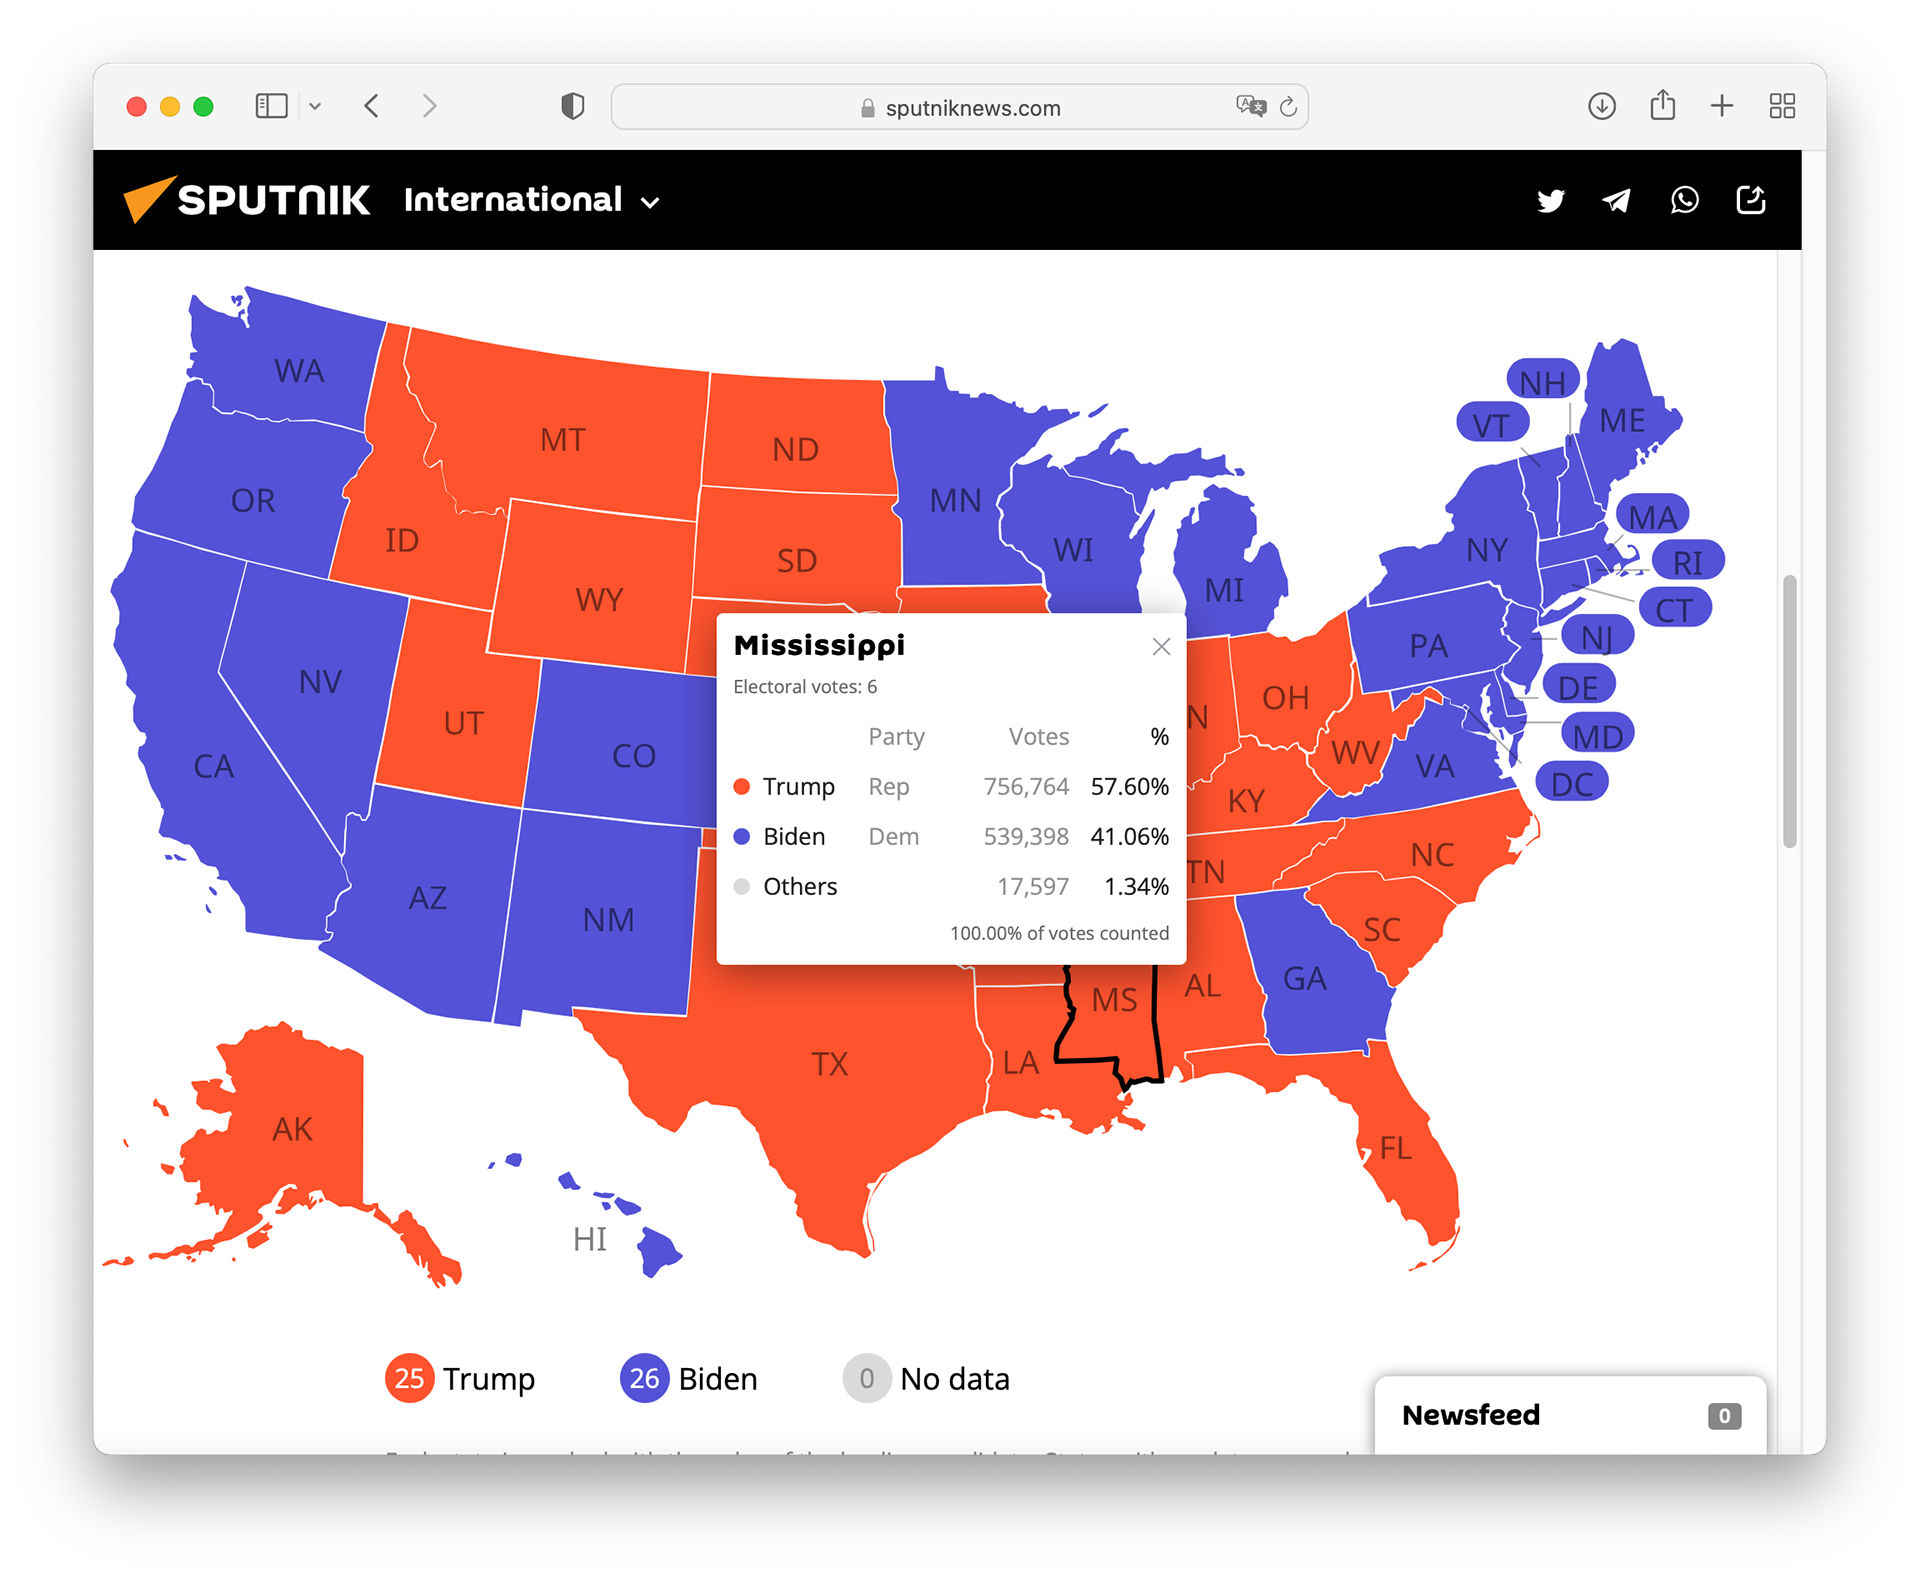
Widgets
Widgets are small interface modules that update automatically and can be integrated into different pages of the platform: election results, exchange rates, polls, etc.
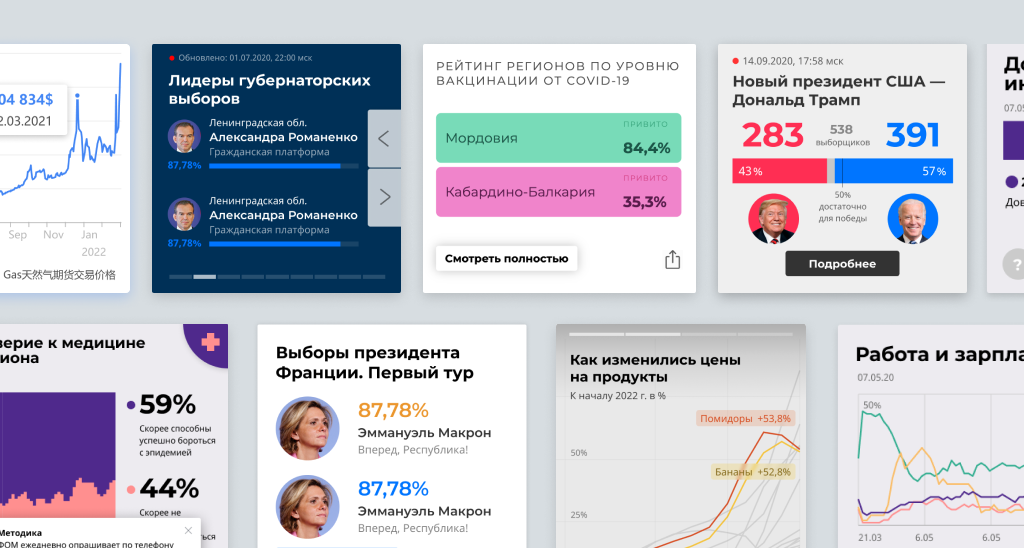
From the widget you can go to more detailed statistics on the topic
Dynamic visualization
For some publications, we developed visualizations that were updated in real time. Most often, it could be some kind of election or competition. But we also updated various election statistics.
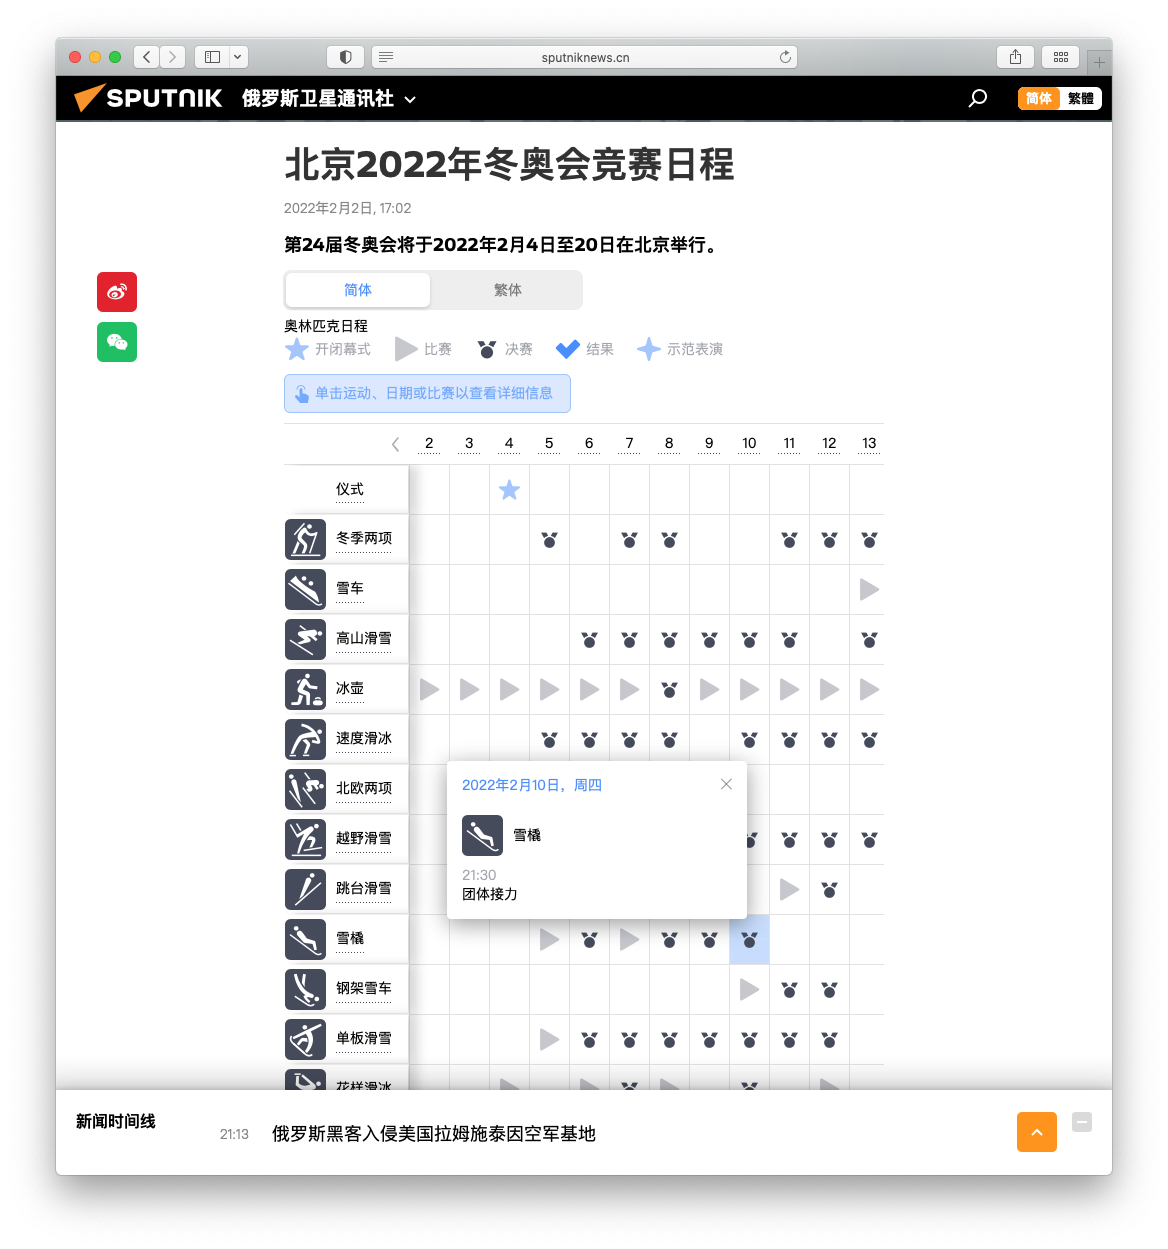
Tools
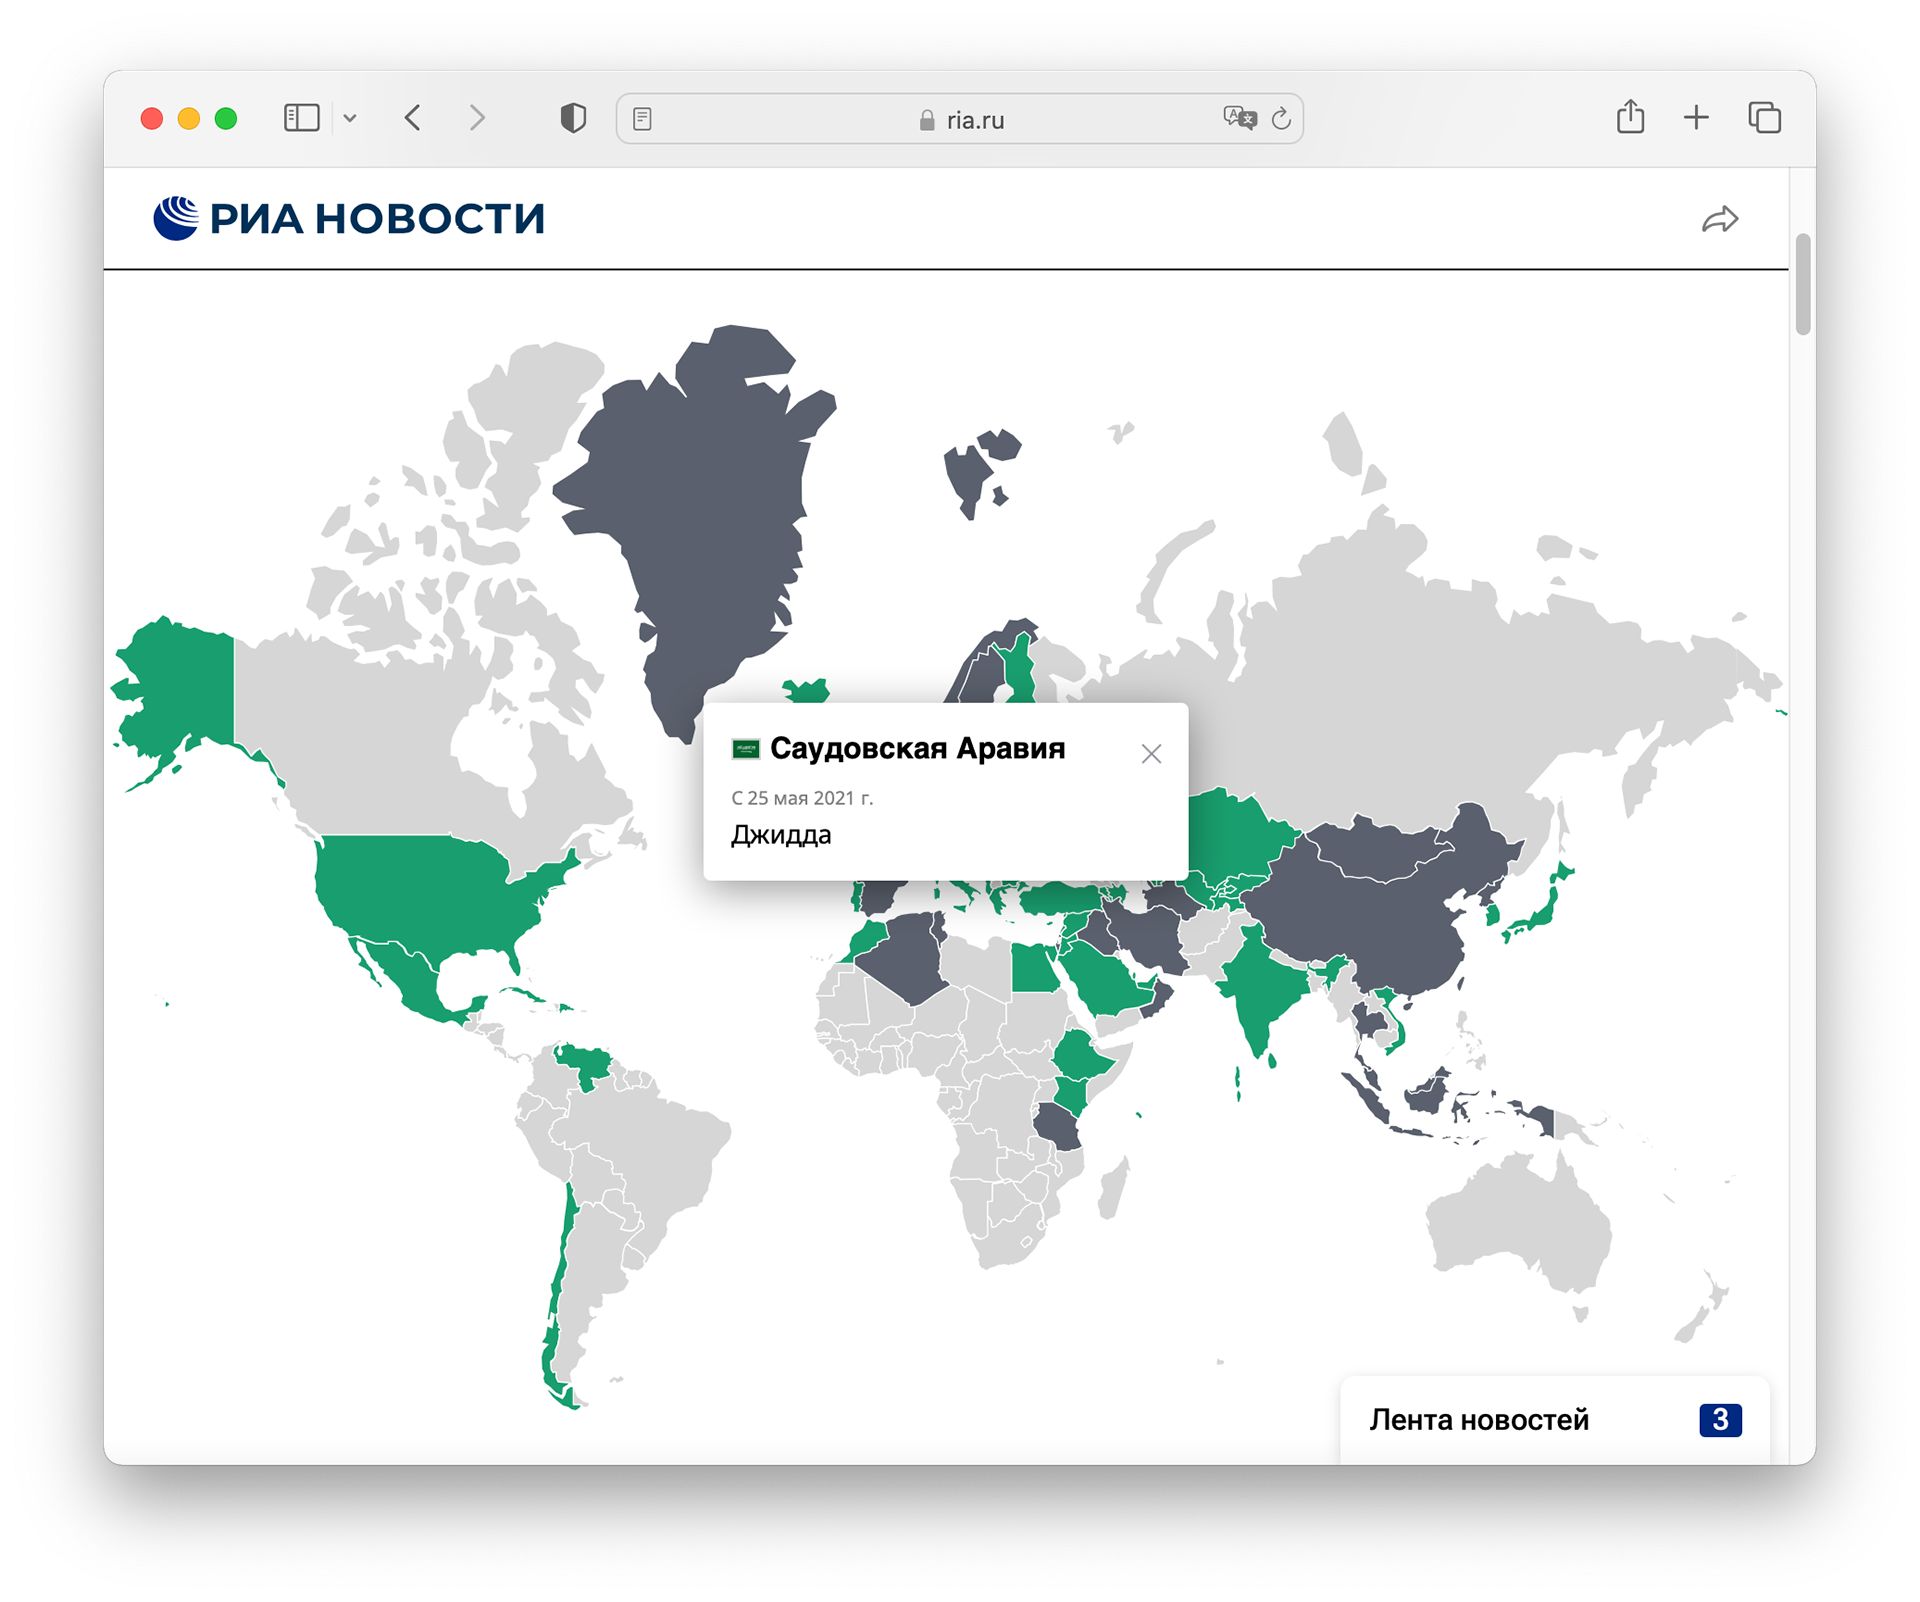
We have developed various publication formats for mobile and desktop screens: race chart, tiled map of Russia, slide-show, cards-stories, image with zoom, picture was/then and others.
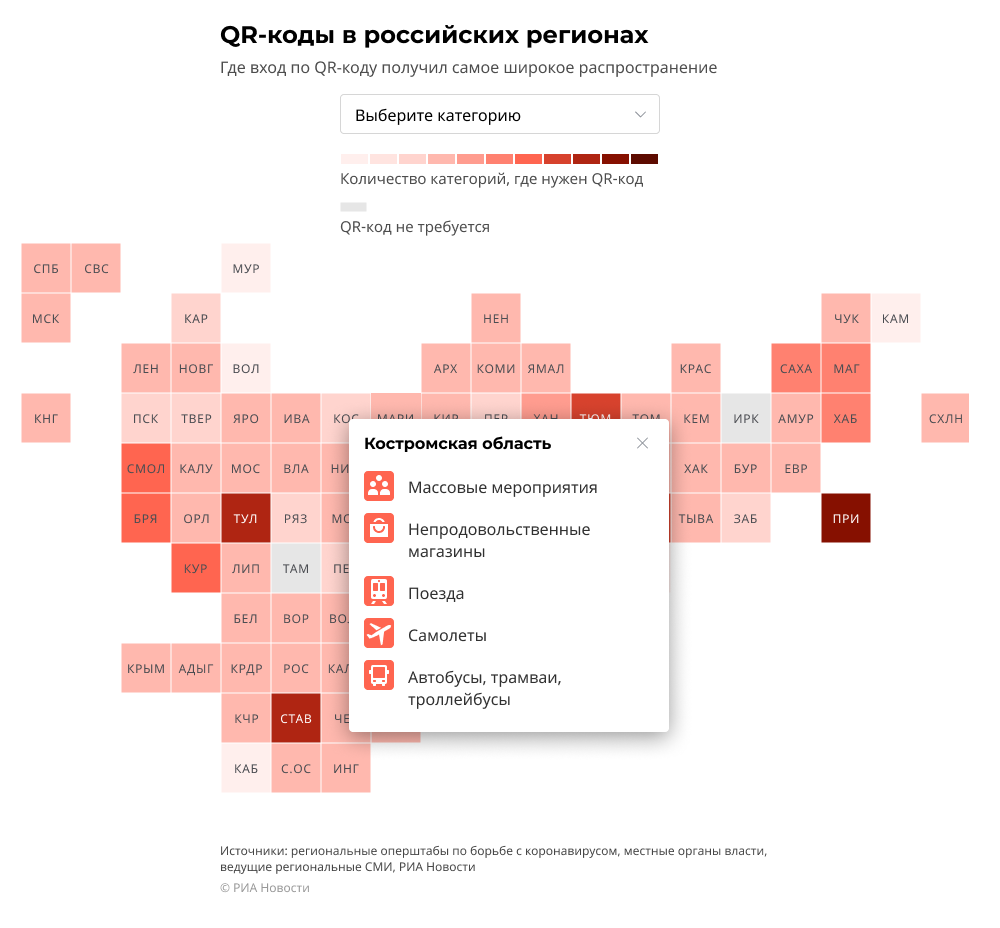
If we saw that a certain format was popular, we tried to develop a template for it that the client could fill out independently and without the participation of a designer or developer. For example, we have put together a separate tool for creating a tiled map with pop-ups.

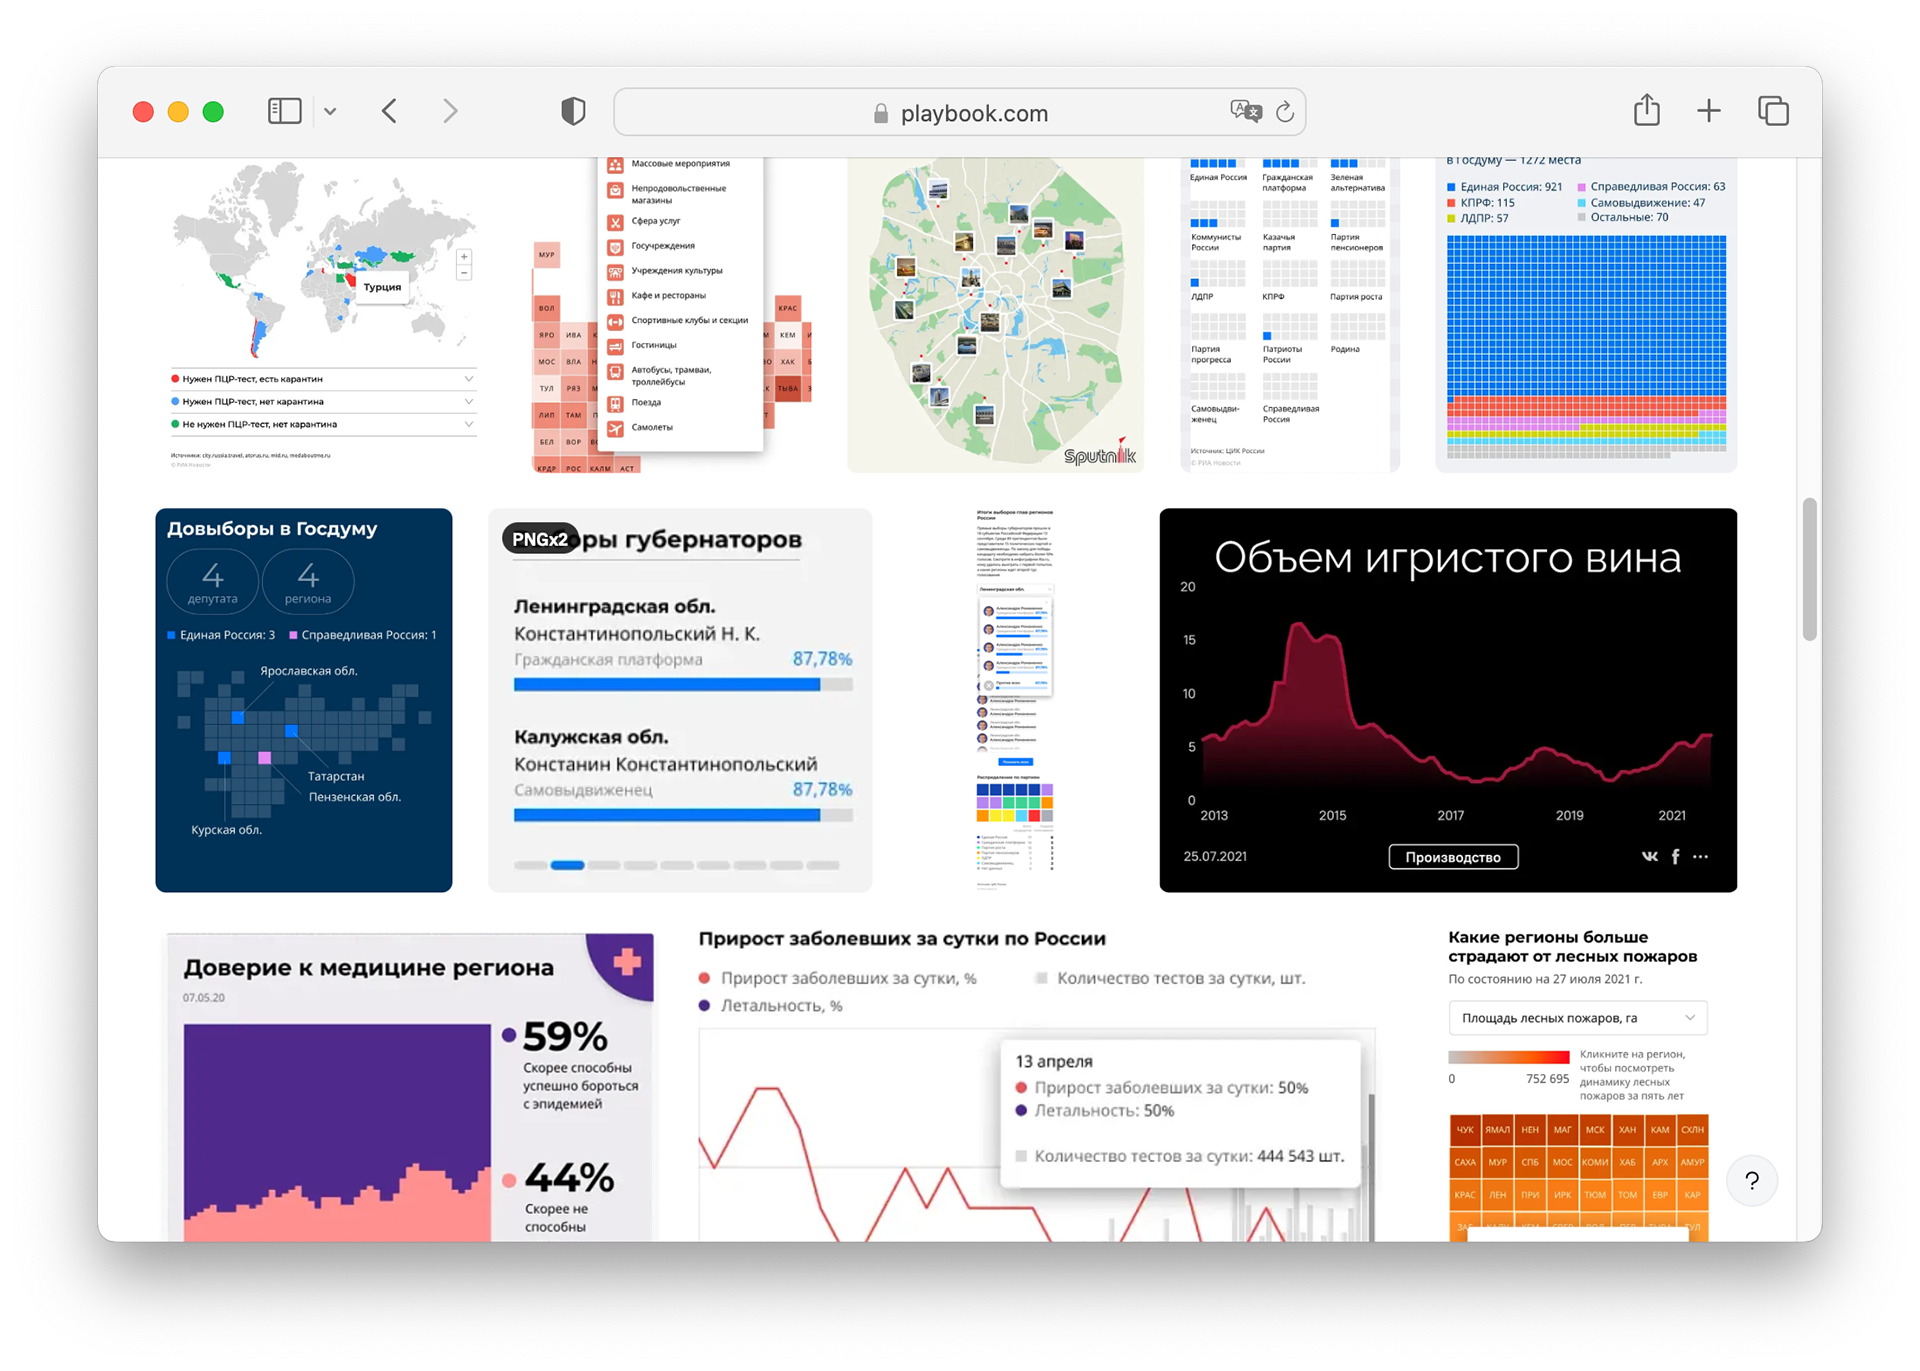
And a separate tool for creating animated charts (race chart).
Watch more on playbook collection
✦ Thanks for watching